
Crypto's Deep Drawdown
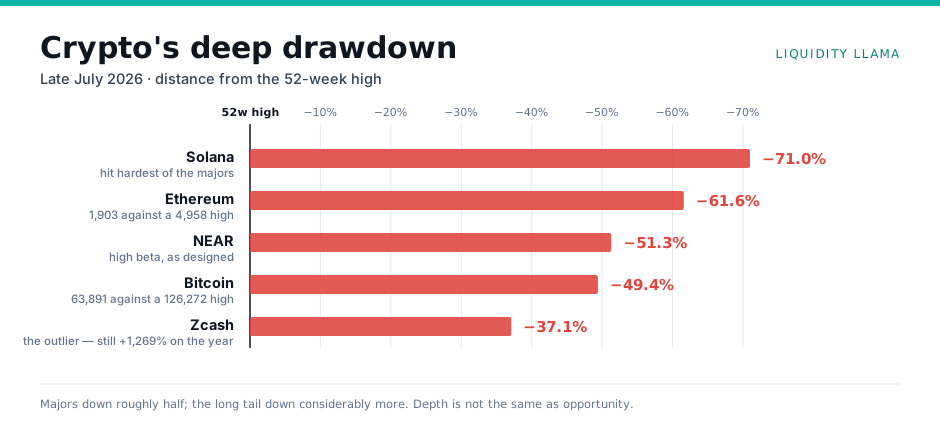
Bitcoin is 49% below its high, Ethereum 62%. That's a bear market by any definition — but it's a notably orderly one, and the ETH/BTC relationship is saying something specific.
The state of play
| Asset | Last | 52w high | 52w low | Drawdown | Range position |
|---|---|---|---|---|---|
| Bitcoin | 63,891 | 126,272 | 57,735 | −49.4% | 9% |
| Ethereum | 1,903 | 4,958 | 1,506 | −61.6% | 12% |
Bitcoin has roughly halved from its high. In most asset classes that would be a crisis; in Bitcoin it is close to a normal cyclical drawdown — the 2018 and 2022 bear markets both exceeded 70% peak to trough, and drawdowns of 30–40% have occurred repeatedly inside bull markets. Context isn't comfort, but it is context.
What's more interesting than the depth is the character of it. Bitcoin is unchanged today while equities fall 1.5–2% and semiconductors drop nearly 5%. An asset down 49% that refuses to make new lows during a broad risk-off session is behaving differently from one in active liquidation — the marginal seller appears to be finished, even though the marginal buyer hasn't yet arrived in size.
1. Why Ethereum is losing ground to Bitcoin
The 12-point gap in drawdown — 62% versus 49% — is the most informative number here. ETH/BTC has been grinding lower through the cycle, and the explanation is structural rather than sentimental.
Bitcoin's investment case has consolidated around a single, legible idea: a scarce asset held for monetary reasons, now with regulated ETF access and a straightforward story for allocators. Ethereum's case is more complex — a productive asset whose value depends on network usage, fee burn and the retention of activity that layer-2s and competing chains have partly absorbed.
In risk-off conditions, complexity is penalised. Capital consolidates into the most liquid, most legible expression of a theme and abandons the rest. That's the same mechanism visible in equities today, where Apple sits near its highs while speculative quantum names fall 9%. Crypto isn't behaving differently from the rest of the risk complex; it's expressing the identical preference for simplicity.
The practical implication: ETH/BTC is a cleaner read on genuine risk appetite within crypto than either asset's dollar price. Until that ratio stabilises, rallies in altcoins are likely to be sold.
2. The correlation question
Today's session is a useful natural experiment. Equities and long bonds both fell hard; Bitcoin was flat. Over the past year, though, the direction of travel has been unambiguous — BTC peaked around 126k and has spent the period since falling alongside the compression in speculative risk appetite that also hit unprofitable tech and quantum names.
My read is that crypto's correlation to equities is regime-dependent rather than fixed. It approaches 1 during liquidity contractions, when everything is sold to raise cash, and decays toward zero in calmer conditions when idiosyncratic drivers reassert. That framing explains both the drawdown and today's flat print without needing a special story for either.
What it means for portfolio construction is worth stating plainly, because it's the opposite of the marketing: crypto's diversification benefit is weakest exactly when it's needed most. An asset that decouples in calm markets and correlates in stressed ones is not a hedge.
3. What the macro framework implies
The macro backdrop from my composite is mixed in a way that matters more for crypto than for equities. Two inputs dominate:
- Rates. TLT is at a 52-week low, which means long yields are at highs. Bitcoin is a zero-cash-flow, long-duration asset; its discount rate is the entire valuation. Rising long yields are a direct headwind, and this is the clearest macro transmission channel into crypto.
- Liquidity. The labour signal is bearish (June payrolls +57k against ~115k consensus) and 2026 hike odds have been pared to roughly 42%. A weakening labour market that eventually forces easier policy is, historically, the condition under which crypto bottoms — but the sequence usually runs weak data → risk-off → policy response → recovery, and we appear to be in the middle stage, not the last one.
That sequencing is the crux. The same weak labour print that eventually becomes the bull case is, in the interim, part of the bear case. Anticipating the policy response before the risk-off phase has finished has been a reliable way to be early and wrong.
4. Levels and structure
Applying the level framework from my 503-session study — where prior-day and prior-week lows were the only levels with a measured edge — the structurally significant zones are:
The 57,735 level is the one that matters for Bitcoin. It has held as the cycle low; a decisive break would confirm continuation and put the 2022-style 70%+ drawdown scenario back on the table, which from 126k implies something near the high 30,000s. Holding it keeps the current structure — a wide, grinding base — intact.
I'd apply the same discipline here as anywhere: the sweep-and-reclaim pattern is the trigger I'd want at a level like that, not the level itself. A sweep of 57,735 that reclaims quickly is a materially different event from a close below it, and the study says the difference between those two is most of the edge.
5. Honest uncertainties
Three things I can't resolve and won't pretend to:
- Whether the four-year cycle framework still applies. With ETFs, institutional custody and a very different holder base, the halving-driven cycle model may simply be obsolete. Many people are anchoring to it. I don't know that it holds, and neither do they.
- Flows. Spot ETF flows now materially affect price and are opaque in real time. Any read that ignores them is incomplete, and I don't have a reliable live measure of them.
- Whether this is late-bear or mid-bear. The structure — holding above the lows, flat on a risk-off day — is more consistent with basing than with capitulation. But basing patterns are only identifiable in hindsight, and "it stopped going down" has preceded plenty of further declines.
For educational purposes only. Market data as at 30 July 2026 via TradingView and subject to change. Cryptoassets are highly volatile and largely unregulated; losses can be total. Nothing here is investment advice or a recommendation to buy or sell any asset.