Methods tested before they’re trusted. Where a setup works, the numbers are here; where it doesn’t, that’s here too. Sample sizes, timeframes and limitations are stated in every study — a clean narrative and a positive edge are not the same thing.

The naked-levels method trades prior-day and prior-week levels — open, high, low and the EQ midpoint. The question worth answering before risking anything: on first touch, which of those levels are actually respected? I tested all of them across 503 daily sessions.
Note on scope: this study covers the extremes and the midpoint. It does not cover naked points of control, which the indicator also plots — an NPOC sits inside prior value rather than at an extreme, so there is no reason to assume these hit rates carry over to it. That is a separate test, not yet run.
Support holds; resistance doesn’t. Prior-day low and prior-week low are the only levels with a real edge on first touch. Prior-day open is marginal. The highs and the EQ midpoint are coin-flips at 48.6–50.3% — meaning there is no edge in fading them blind, which is precisely why the method demands order-flow confirmation rather than a mechanical bounce trade.
The timeframe finding mattered more than the hit rates. The documented 12-tick stop only makes sense at 1m–5m. At 30m it sits inside the noise, and first-touch fades won just 28%. The sweep-and-reclaim trigger is a 1m/5m order-flow signal and forms zero times on 30m bars. Run the trigger on the resolution it lives on, never on a higher one because the data was easier to get.

A companion study applying the same discipline to swing-failure patterns: measure the hit rate at first touch before trusting the setup, rather than sizing on a chart that looks convincing in hindsight. Methodology mirrors the naked-levels study so results are directly comparable.
Status: data collection. Results will be published here with the same caveats — including if the answer is “no edge.”
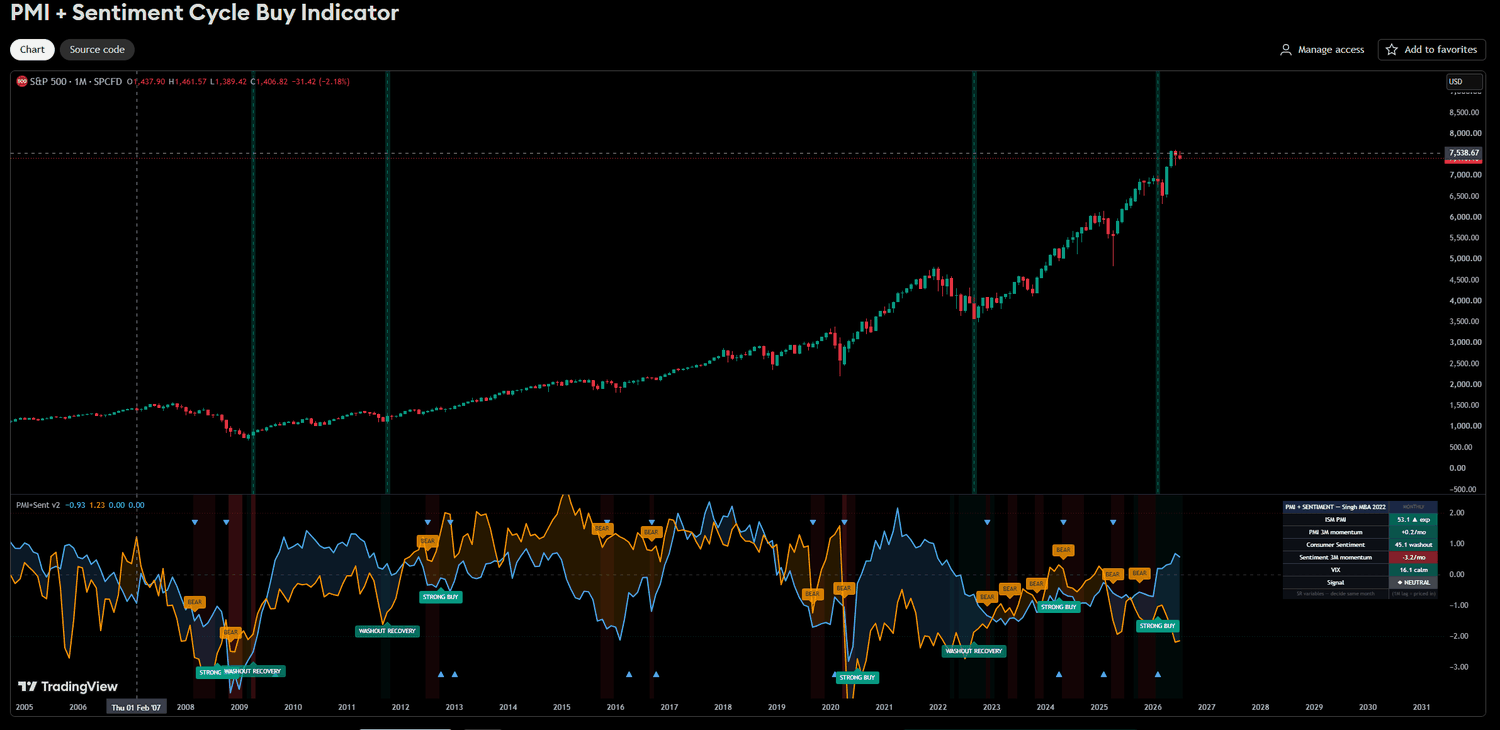
A rules-based read of the ISM Report On Business: go long cyclicals with pricing power when the PMI is rising and broad-based, underweight the industries already contracting. Built as a repeatable monthly system — one editable data file regenerates the dashboard, the Excel tracker with its sub-index heatmap, and the written playbook.
Unresolved: the “long cyclicals when PMI is rising” rule has not yet been backtested end-to-end. PMI is a diffusion survey rather than hard output, and the market may already price it. Until the test is run, the tilts are research starters.
Every study states its instrument, sample size, timeframe and the exact rule being tested. Hit rates are reported for the full sample, not a favourable window. Where free data is too thin to answer a question, the study says so rather than reporting a number that looks precise and isn’t.
Two failure modes worth naming, because they affect how any published result should be read: overfitting — a rule tuned until history looks good will rarely survive contact with live markets; and edge decay — a genuine edge that becomes widely known tends to stop working. Neither is solved by a bigger backtest.
For educational purposes only. Backtested results are not indicative of future performance and do not account for slippage, fees or live execution. Nothing here is investment advice.
The regime report, the PMI buy/sell playbook and any new backtests — sent when they publish. No spam, unsubscribe anytime.
