
Do naked levels actually hold?
Prior-day low holds 57.8% of first touches, prior-week low 55.4% — and the highs are coin-flips. Plus why the 12-tick stop fails on 30m bars.
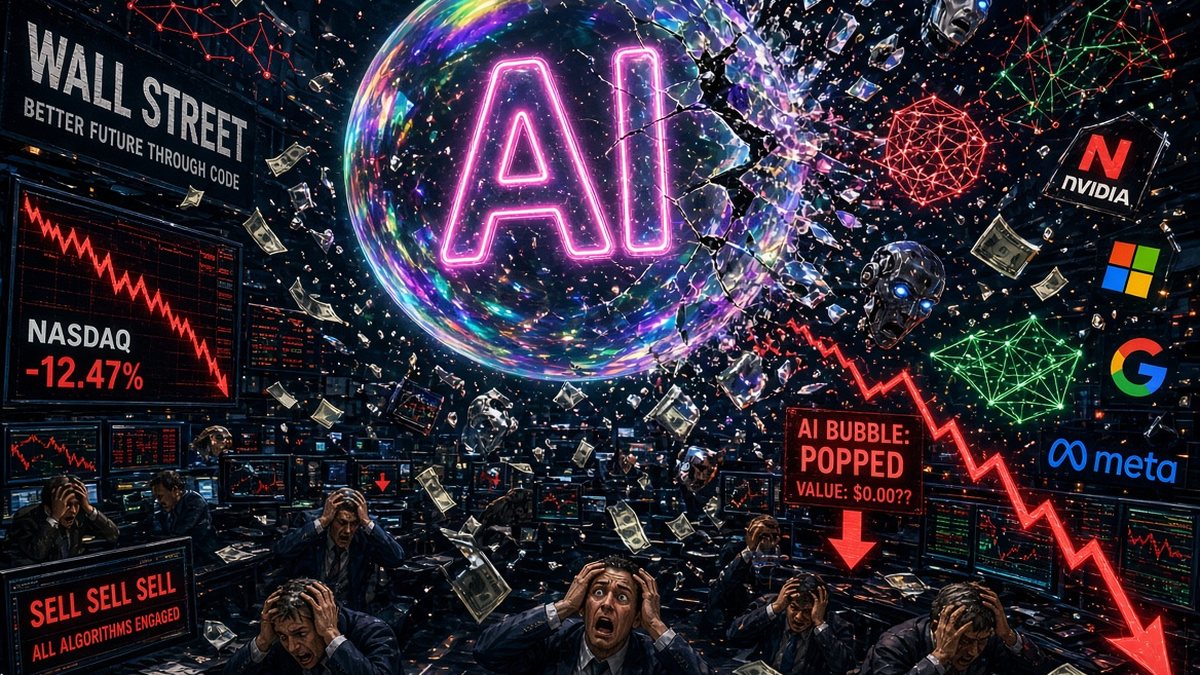
Three AI bosses said the race should slow down, and the tape read it as the end of the trade. Run it through the numbers and it cuts the one cost line standing between these labs and a profit — OpenAI burns 57% of revenue, Anthropic 33%. Semiconductors fell 15.4% into the Fed with almost everyone leaning bearish. Since the 16 September hike they are up 6.7%.

Gold is 26% below its January record and has fallen through a war and a $40 trillion debt pile. The reason is a 2.9% real yield, the highest since 2008. The bull case needs a Fed that prints, and Warsh would rather cut. Four scenarios, and the level I’m watching.

Google booked $77bn after tax of unrealised gains on Anthropic and SpaceX last quarter — 69% of its earnings per share. Those same two companies now pay SpaceX $26bn a year for compute, on contracts cancellable in 90 days. Every arrow is disclosed. The question is whether the loop rests on anything outside itself.
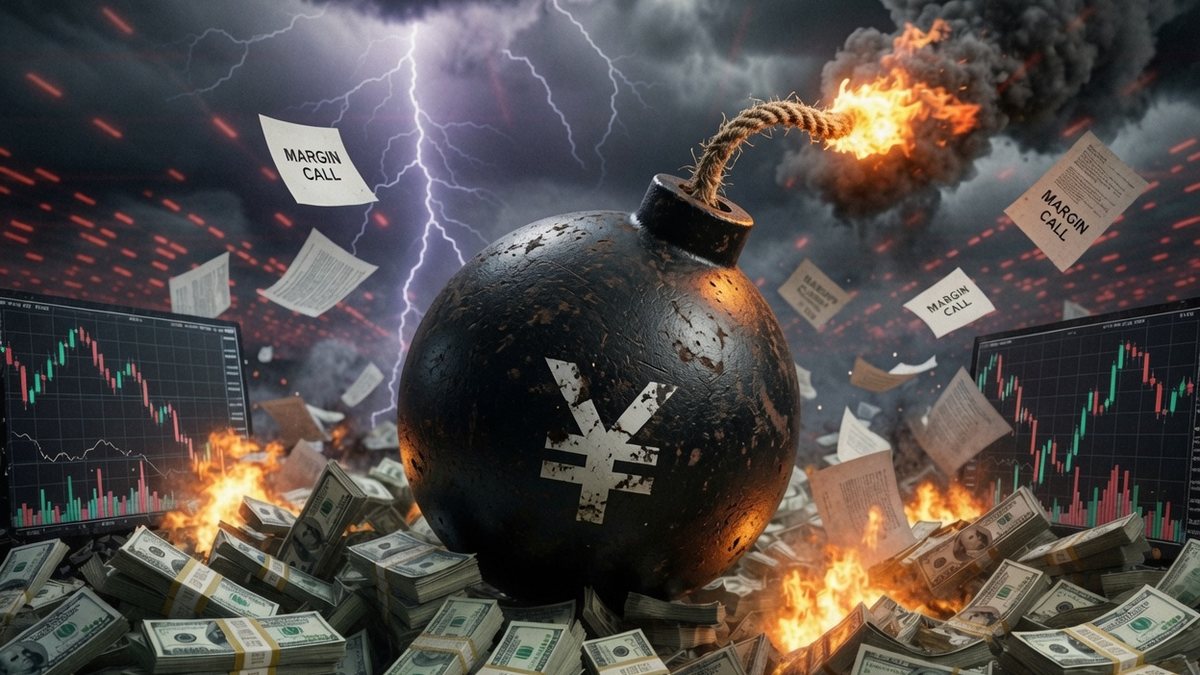
Japan and the United States just ran their first joint yen intervention since 2011. The trade underneath it is real, leveraged, and has broken markets before. It is also paying half what it paid in 2024 — and almost nobody explaining it has mentioned that.
 Essay · Pinned
Limitless was never a pill. It was Claude all along.
It’s 1am. Baby’s finally asleep. I’m at my desk doing what the cool kids call “vibe coding,” and for the first time in months the screens feel alive again.
Julius Stark · 6 May 2026 · Read on X →
Regime score, PMI buys and sells, new research and the updated track record — once a month when it publishes.
Down from −2 in September: breadth, volatility and prices weakened, the curve improved. −3 is exactly the bear threshold. September’s published −2 should have been 0 on the curve rule as written — the report explains. The August report used an older 15-signal model, so its score isn’t comparable.
From the September ISM Report On Business, released 1 October: manufacturing 54.5, a ninth straight month of expansion. New orders rose 1.6 to 55.3 and backlogs 4.6 to 56.4, so the order book is refilling — but prices paid jumped 6.8 to 77.9 and only 12 of 18 industries grew, down from 15. Growth is concentrating in electrical equipment, electronics and metals. Research starters, not advice.
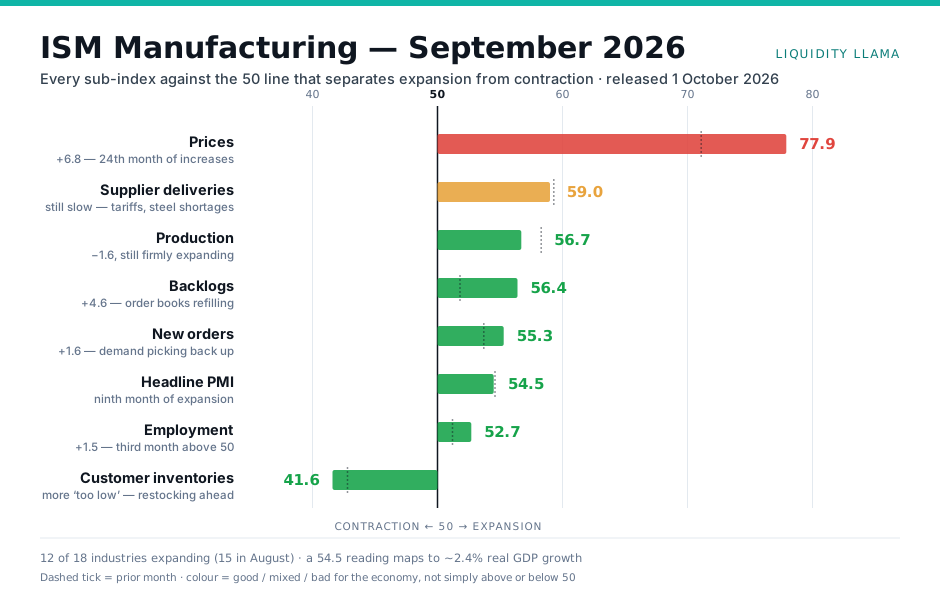
Tilts are relative calls within the market. With the regime at −3, on the bear threshold, size everything down. Financials come off the sell list this month: the curve stopped flattening.
The full report goes further: what’s good, what’s bad and what to watch — plus the named ideas each tilt points at, the sub-index driving each one, what would prove it wrong, and how last month’s names did. Read the playbook →
Sourced from the ISM Report On Business · older monthly reports are archived in Reports →
Prior-day low holds 57.8% of first touches, prior-week low 55.4% — and the highs are coin-flips. Plus why the 12-tick stop fails on 30m bars.
Open ideas with entry dates and honest marks — GS/JPM spread +2.4%, Korea EWY +8.3%, India upgraded. Losers stay on the page too.
Survivorship bias, edge decay and the gap between backtest and live execution — and what does transfer.
Type a ticker, read the live financials, then run P/E, DCF and ROE valuations with every assumption editable.
Liquidity sweeps, CVD, market profile, diffusion indexes and regime scoring — defined without mystique.
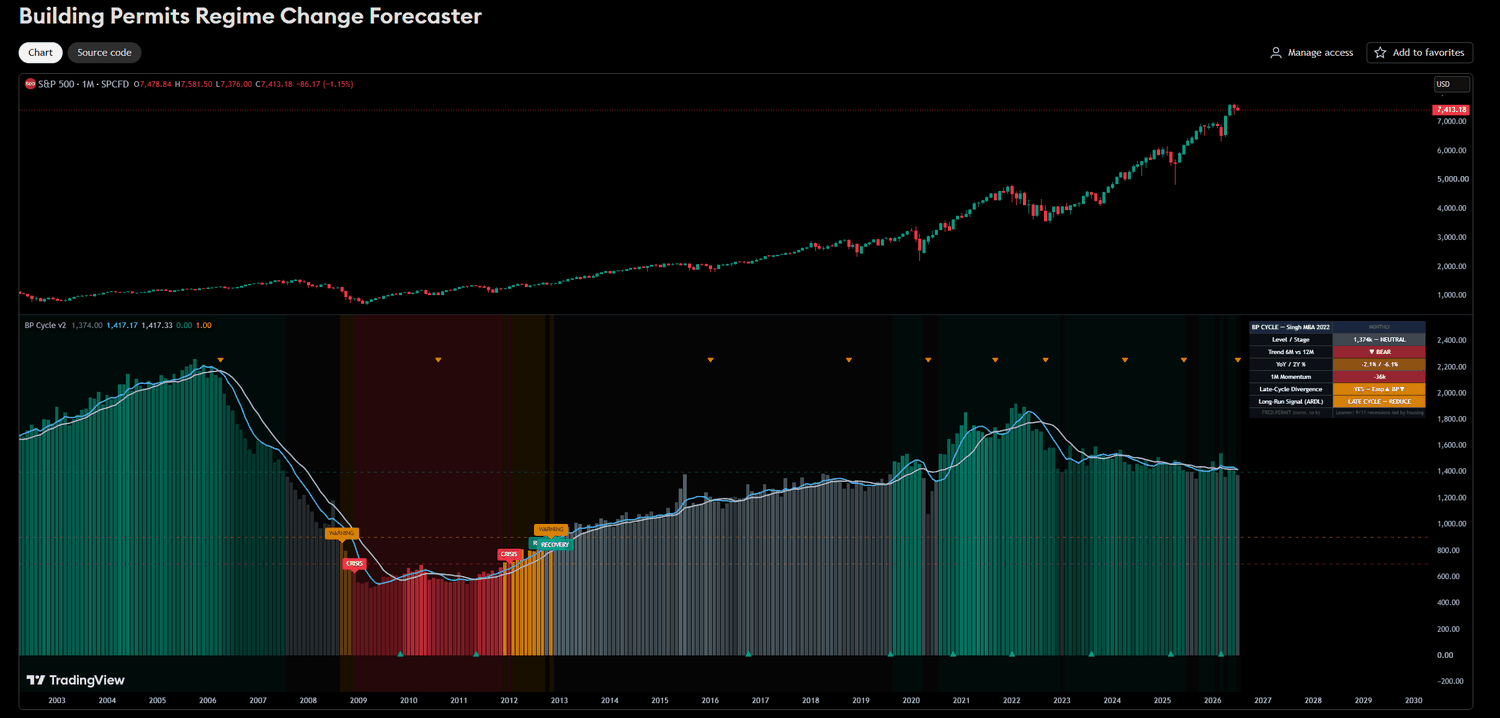 Macro cycle
Reads the housing-permit cycle to flag WARNING → CRISIS → RECOVERY regimes. Currently late-cycle, BP trend bearish.
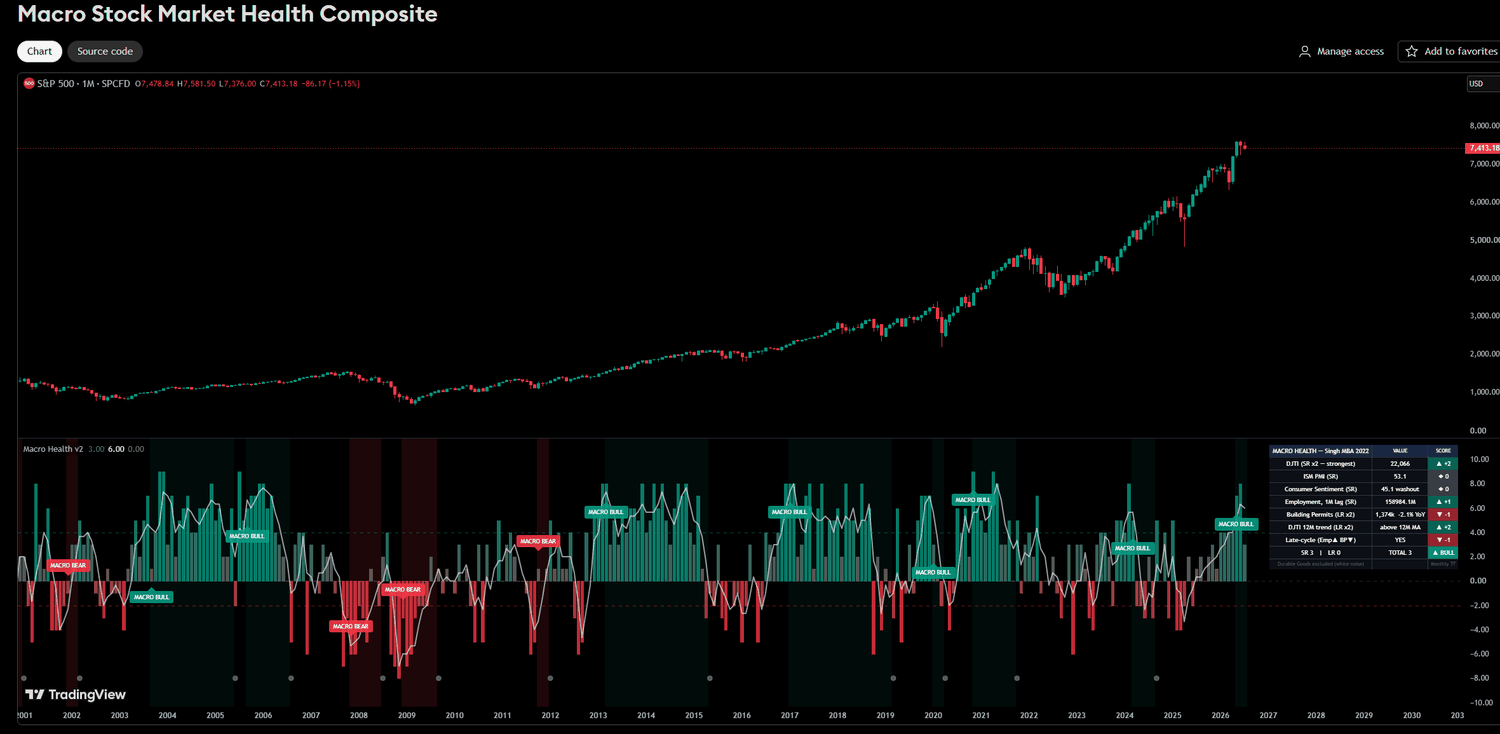 Macro composite
Eight macro inputs scored into one MACRO BULL / BEAR read. Latest: +6, macro bull, dragged by building permits.
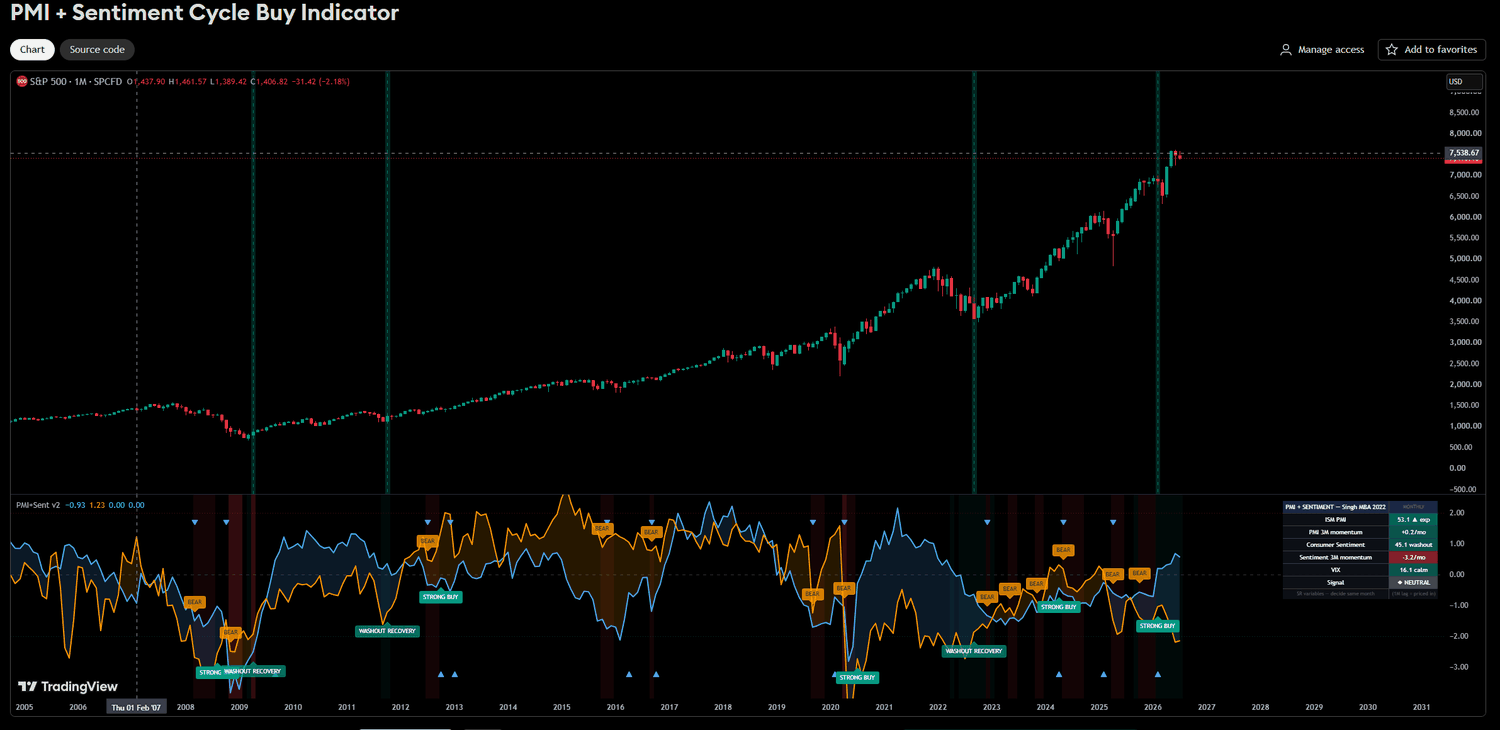 Timing
Combines ISM PMI with consumer sentiment and VIX to time STRONG BUY washouts. Current signal: neutral.
When I trade I have a plan of a level, alert goes off, assess reaction at the level, take the trade. My whole feed was long yesterday at the highs — often a great counter signal. Take profit 1, stop to break even, let the rest ride. #BTC