
The Equity Tape — Late July 2026
Three weeks ago the framework read +6 and bullish. The tape has since deteriorated badly. Here's what my indicators say now, what the regime score got wrong, and what a mechanical process does about it.
Start with the uncomfortable part
On 6 July the composite regime score read +6, BULLISH. On 30 July the Nasdaq 100 is 2.0% lower on the day, semiconductors are down 4.8%, and industrials — the sector I flagged as making new 52-week highs — are down 3.2%. The framework was not positioned for this.
It's worth being precise about how it was wrong, because that determines whether the process needs changing or simply needs following. The score is a monthly, mechanical read of medium-term conditions. It is not designed to catch a three-week momentum unwind, and it didn't. Two of its inputs — labour (bearish) and volatility (downgraded to neutral on rising realised vol) — were already flashing caution. The breadth input, which read bullish on the XLI 52-week high, is the one that has aged worst.
Where the tape actually is
| Instrument | Last | Day | From 52w high |
|---|---|---|---|
| S&P 500 (SPY) | 729.46 | −1.54% | −4.1% |
| Nasdaq 100 (QQQ) | 661.73 | −2.04% | −11.6% |
| Semiconductors (SMH) | 504.22 | −4.79% | −24.9% |
| Nvidia | 190.01 | −3.55% | −19.7% |
| Industrials (XLI) | 176.66 | −3.19% | −5.2% |
| Homebuilders (XHB) | 104.68 | −4.52% | −15.0% |
| Financials (XLF) | 56.68 | −1.60% | −1.6% |
| Energy (XLE) | 58.65 | +1.88% | −7.6% |
| Apple | 338.19 | −0.56% | −1.9% |
| Tesla | 298.32 | −2.97% | −40.2% |
| Long bonds (TLT) | 82.85 | −1.65% | at 52w low |
| VIX | 20.65 | +13.5% | — |
1. This is not a rotation. It's a de-risking
The distinction matters enormously for what you do next. In a rotation, money leaves one sector and arrives in another; the index holds up and leadership changes. That's what markets were doing in the spring.
Today, equities are down and long bonds are at a 52-week low and crypto is soft. When stocks and bonds fall together, the driver is usually not growth fear — growth fear buys bonds. It's a repricing of discount rates and a reduction in gross exposure. Only energy (+1.9%) and gold (+0.5%) are meaningfully green.
The single most informative line in that table is TLT at a 52-week low. That removes the usual shock absorber. A balanced portfolio has no hiding place in a session like this, which mechanically forces further de-grossing — and that's what produces the disorderly, everything-correlated tape.
2. Distance from trend, not oscillators
I'm deliberately not going to tell you the market is "oversold." Oscillators are derived from the same price series they claim to predict, and in a trending tape they simply describe what already happened. In 2022 they read oversold repeatedly, the whole way down.
The more useful question institutional desks ask is how far price sits from its own long-term trend, and what that distance has been worth historically. QQQ at 661.73 is roughly 2.6% above its 200-day moving average at 644–649. That is not a stretched market — it is a market that has given back its extension and is now sitting on the line that separates "correction within an uptrend" from "trend change."
Three things I weight more heavily than any indicator reading:
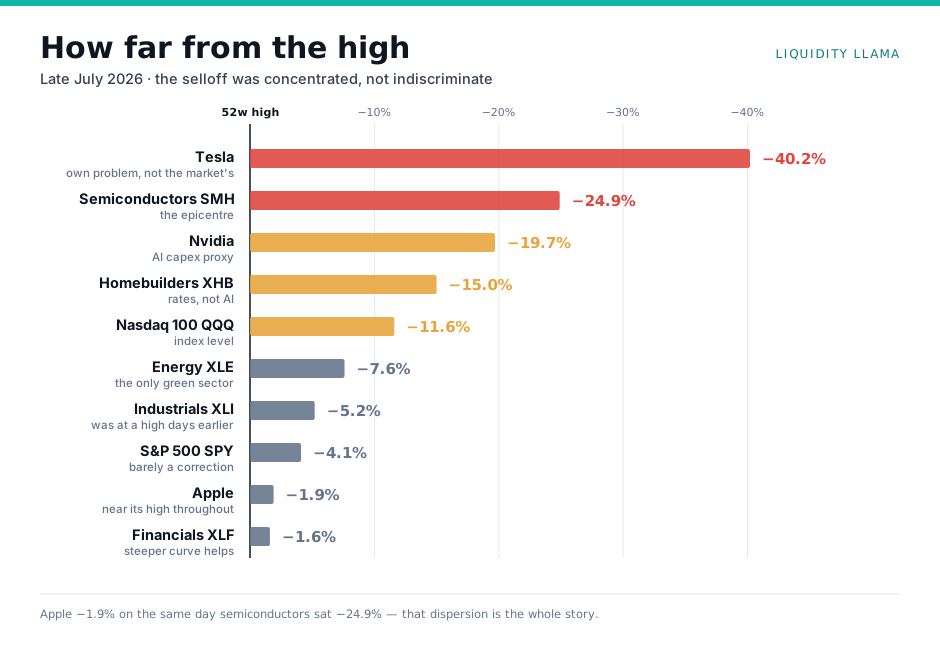
- Breadth versus index. The index is down 11.6% from its high while semiconductors are down 24.9% and Apple is down 1.9%. A decline concentrated in one factor is a de-rating of that factor. A decline where everything falls together is a liquidity event. This is clearly the former, which historically resolves faster and with less permanent damage to the index.
- Cross-asset confirmation. Equities and long bonds falling together tells you the driver is the discount rate, not a growth scare — growth scares bid bonds. That single observation reframes the entire move.
- Volatility term structure. Implied vol at 20.65 is elevated but not panicked. Genuine capitulation in this index has historically required considerably higher readings alongside a backwardated curve. We aren't there.
The level that matters is 644–649. Not because a line has magic properties, but because it is where a very large amount of systematic and trend-following capital has its risk defined. Those flows are mechanical and observable, which makes the level a genuine liquidity event rather than a chart pattern.
3. What the Macro Health Composite says
My Macro Stock Market Health Composite reads the economic series rather than the tape, which makes it useful precisely when the tape is loud. Its most recent monthly state: score +6, MACRO BULL, with ISM PMI at 53.1, consumer sentiment at 45.1 (washout territory) and building permits contributing −1 with a late-cycle divergence flag set to YES.
That's the crucial nuance. The composite is bullish on the aggregate while explicitly flagging late-cycle divergence — employment rising while building permits fall. Historically that combination has appeared before, not after, the turn. The Building Permits Forecaster has permits at 1,374k, trend bearish, −2.1% year on year, with the long-run ARDL signal reading LATE CYCLE — REDUCE.
Today's homebuilder move fits that: XHB down 4.5% and 15% off its high, with a strong-sell technical rating. The housing thesis I set out in Housing Cracks First is playing out in the equity of the sector before it shows up in the permit data.
4. The divergences worth watching
Two stand out, and they say opposite things:
Apple versus the complex. Apple sits within 2% of its 52-week high while Nvidia is 20% off and semis are down 25%. That is not a market rejecting large-cap technology; it is rejecting AI capex beneficiaries specifically. Apple is the mega-cap with the least direct exposure to the capex cycle — it buys compute rather than selling it. The selloff is discriminating, which argues for a thesis unwind rather than indiscriminate liquidation.
Financials holding. XLF sits 1.6% from its 52-week high on a day the index fell 1.5%. Banks holding up while long bonds sell off is internally consistent: a steeper curve widens the spread between what banks pay for deposits and earn on loans. When a sector's relative strength has a mechanical explanation rather than a narrative one, it tends to persist.
Tesla is the opposite case — a new 52-week low, 40% off its high. That is not the AI trade; it is an idiosyncratic problem in a name that had been carried by the same risk appetite now being withdrawn.
5. Where the order-flow tools apply
In a tape like this, the level-based work has an unusually clean application. My 503-session study found that on first touch, prior-day low held 57.8% of the time and prior-week low 55.4% — the only two levels with a genuine edge, and both are support. Prior-day and prior-week highs were coin flips.
That asymmetry is worth restating in the current context: the levels with a measured edge are the ones being tested right now. But the same study carries the constraint — the edge is small, it requires order-flow confirmation via the sweep-and-reclaim trigger, and it only exists on the timeframe the pattern actually lives on (1–5 minute, not 30-minute). A 57.8% hit rate is an edge; it is not a reason for size.
6. The setup into August
- Energy (XLE) +1.9%, buy rating
- Financials (XLF) 1.6% off highs
- Gold (GLD) +0.5%
- Apple low capex exposure
- Semiconductors −4.8%, −25% off high
- Homebuilders −4.5%, permits bearish
- Quantum names −8 to −9%
- Long duration bonds 52-week low
What I'm actually watching, in order: whether QQQ holds 644–649; whether TLT stops making lows, which would restore the portfolio shock absorber; whether the Apple/Nvidia divergence persists, which distinguishes a thesis unwind from a market-wide de-rating; and the August ISM print, since a PMI roll-over from 53.1 would flip the macro composite from bull to something considerably less comfortable.
My positioning hasn't changed — still heavily in cash, trading only, as it has been since November. That stance has cost me upside for eight months. This week it didn't.
For educational purposes only. Market data as at 30 July 2026 via TradingView and subject to change. This is a description of my own framework's output and my reading of it — not investment advice, and not a recommendation on any security mentioned. Indicator readings are from the most recent monthly refresh and may lag the tape.