
Gold Is Waiting for the Fed to Blink
Gold has fallen 26% from its January record through a war, an oil shock and a $40 trillion debt pile. The reason is rates. The bull case needs a Fed that eventually prints money, and the new chair has spent twenty years arguing against it. Here is how I think that resolves.
The short version
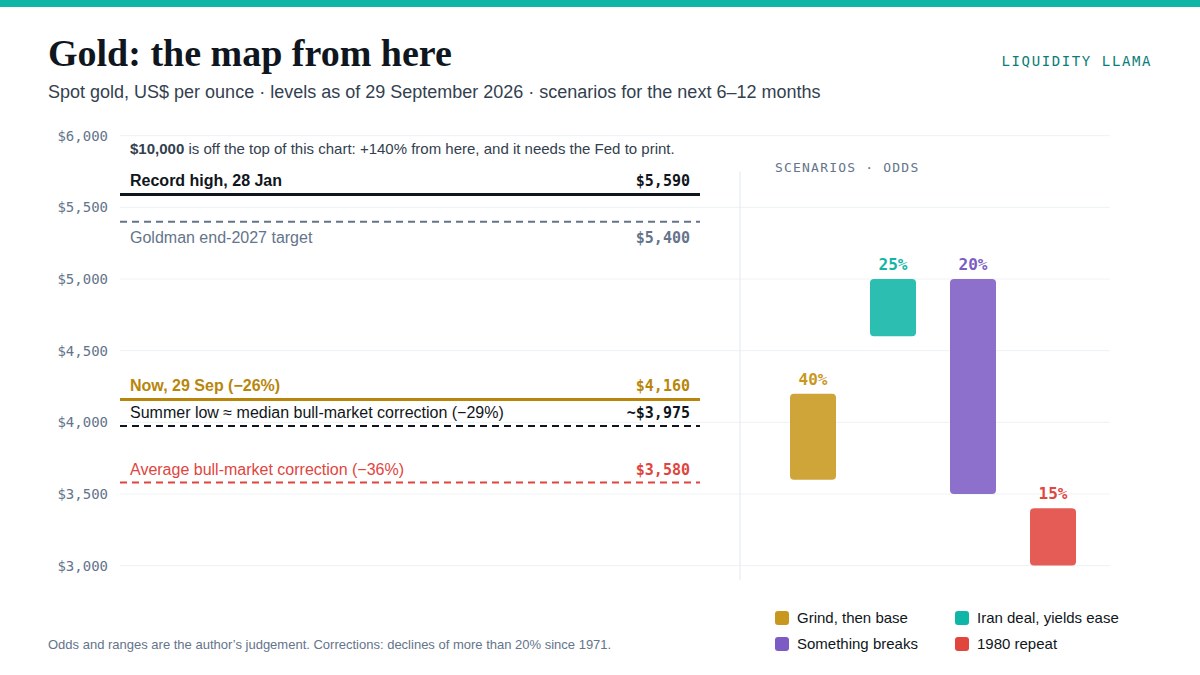
- Gold peaked at about $5,590 on 28 January and trades near $4,160. A 26% fall is large, but it sits inside the normal range for corrections within a bull market.
- The damage comes from rates. The ten-year real yield is 2.9%, the highest since 2008, the Fed hiked on 16 September, and markets put the odds of another hike in October at about 70%.
- Warsh dislikes quantitative easing, but he has said he prefers rate cuts to it. For gold, the cut to zero matters more than the printing, and history shows gold bottoming around the pivot, before any printing starts.
- The buy signal in past cycles was the last hike, not the first. Until the Fed stops, I treat rallies with suspicion, and a break of the summer low near $4,000 opens the way to about $3,600.
Where gold actually is
Gold had a remarkable 2025, rising about 65% to finish the year near $4,340, and it kept going in January. By 28 January it was around $5,590, up almost 30% in four weeks. Two days later President Trump named Kevin Warsh as the next Fed chair, and gold lost close to a tenth of its value in a single session while silver fell around 30%. It has not been back.
From there it drifted lower into the summer, dropping below $4,000 in late June for the first time since November and holding just above that line through July. August brought the best month since January, with prices back around $4,400 and record inflows into gold ETFs. September undid most of it. The Fed hiked on the 16th, yields kept climbing, and on Monday a stand-off over the Strait of Hormuz sent oil back above $105 and gold down to about $4,115 intraday. On Tuesday it was trading near $4,160.
| Level | From record | |
|---|---|---|
| Record high, 28 Jan | ~$5,590 | – |
| 2025 close | ~$4,340 | −22% |
| August rebound | ~$4,400 | −21% |
| Now, 29 Sep | ~$4,160 | −26% |
| Summer low, Jun–Jul | ~$3,975 | −29% |
The detail I keep returning to is that gold has fallen during a war. The US and Israel have been fighting Iran since February, Brent is more than 50% above where it was in January, and the precious metal that is supposed to be the hedge for exactly this is down on the year. That tells you what is actually driving the price.
Why rates beat the war
Gold pays nothing, so the thing it competes with is the return you can get from safe bonds after inflation. That return, the ten-year real yield on inflation-protected Treasuries, is now about 2.9%. It has risen 1.1 percentage points in a year, and the 17 September TIPS auction cleared at the highest real yield since October 2008. When you can lock in close to 3% above inflation from the US government, the case for holding a metal with no income gets harder to make.
The dollar has helped too. The dollar index is at about 101, up nearly 2% this month, and a firmer dollar makes gold more expensive for everyone buying in other currencies.
For three years this relationship barely seemed to matter. In 2022 real yields rose by a record 2.5 points and gold finished the year flat, because central banks, spooked by the freezing of Russia’s reserves, were buying more than 1,000 tonnes a year, roughly double their previous pace. That buying put a floor under the price that bond maths couldn’t explain.
The floor is thinner this year. The World Gold Council revised its first-quarter estimate of central-bank buying from 244 tonnes to 57, which leaves the first half at 345 tonnes, the weakest first half since 2022. Poland has been the biggest buyer, Russia sold 22 tonnes in the second quarter, and China’s central bank, while it bought 20 tonnes in August for its 22nd straight month, isn’t buying on the scale that carried 2023 and 2024. With less official buying underneath, the old link to real yields has started working again, and this year it has worked against gold.
Gold is falling during a war because cash and bonds have started paying properly again.
The Warsh problem
Kevin Paffrath, who runs the Meet Kevin channel, made the call on 30 January that the Warsh nomination marked the top for gold, and so far he has been right: the record came two days earlier. His reasoning, which he restated in a recent video, is that Warsh has spent two decades arguing against large balance sheets and money printing, and without the Fed printing to bail out markets gold doesn’t recover.
The record supports the first half of that. Warsh called the Fed’s balance sheet bloated before he got the job, told the Senate he wanted a “regime change in the conduct of policy”, and has argued that quantitative easing helps the people who own financial assets before anyone else. Since he took over in May the Fed has shortened its statements, dropped the easing bias, held in July with three officials voting to hike, and then raised rates on 16 September by a unanimous 12–0. The committee’s own projections now show rates staying around 4.1% through the end of 2027, with no cuts until 2028.
The second half is less clear. For all the rhetoric, the balance sheet isn’t shrinking. Quantitative tightening ended in December 2025, the Fed is still buying Treasury bills to keep reserves ample, and Warsh has sent the question of a smaller balance sheet to a task force that won’t report until early 2027. His own words point the same way. In May he said rate cuts benefit a broader group of people than quantitative easing, which “tends to move through financial assets first”. In other words, his first tool in a crisis is the rate, and he has been clear he would use it.
That matters for gold more than it first appears. Gold responds to real yields, and the fastest way to crush real yields is to cut rates hard. A Fed that goes to zero and promises to stay there, without buying a single bond, still takes real yields from nearly 3% towards zero, and that alone would be one of the most bullish things that could happen to gold. So I’d adjust Kevin’s framing. Warsh’s dislike of printing limits how high gold can eventually go, but it doesn’t decide whether gold finds a bottom. The bottom comes with the pivot.
The bull case
The most aggressive version doing the rounds this week is a piece from the Fringe Finance newsletter, republished on ZeroHedge, arguing that the bond market is about to break the stock market. The argument runs like this: the ten-year at 5.21% is the highest since 2007 and the 30-year is at its highest in more than two decades, so bonds now compete seriously with stocks at a time when equities are priced for perfection and leverage is high. Something eventually breaks, the Fed rescues it, and if that rescue ends in yield-curve control while deficits stay large, the author says $10,000 gold becomes “considerably less ridiculous”.
The ingredients are real, and they are worth listing.
- Fiscal. Federal debt passed $40 trillion in August. The CBO expects a $1.9 trillion deficit this year, debt held by the public is 101% of GDP, and net interest, at over $1 trillion, now costs more than defence.
- Demand for Treasuries is wobbling. The 10-, 20- and 30-year auctions in September all tailed, pricing at higher yields than the market expected, which means buyers wanted extra yield to take the supply.
- Leverage. Margin debt is $1.45 trillion, up 37% in a year. Kevin’s point that leveraged ETFs and options don’t appear in that number is a good one, so real leverage is probably higher than the data shows.
- AI credit. The hyperscalers raised about $300bn of debt in the first seven months of the year against $108bn in all of 2025. Oracle’s credit default swaps hit a record in July, and CoreWeave’s implied roughly even odds of default over five years on a standard model.
Then there is the steadier institutional case. Vontobel moved gold to overweight at the start of September, citing a weaker dollar over time, central-bank demand and fiscal risk, and the research Kevin quoted calls the recent drop a tactical pullback. Goldman cut its end-2026 target to $4,650 last week but kept $5,400 for the end of 2027, arguing that rate hikes change the timing rather than the destination. And investors are still buying: global gold ETFs took in $18bn in August to reach a record 4,189 tonnes.
How realistic is $10,000? From $4,160 it needs a gain of about 140%. That isn’t unprecedented. After the Fed went to zero and started buying bonds in 2008, gold rose about 166% from its low to the 2011 peak in under three years. But that took zero rates, two rounds of quantitative easing and a weak dollar all at once. It is a scenario that needs the full rescue, and the chair currently in charge is the one least likely to offer it.
The bear case
The bear case starts with the fact that the conditions that hurt gold most are the ones in place now. Gold does badly in hiking cycles when real yields move from negative to firmly positive, and real yields have gone from about 1.9% in March to 2.9% today. Inflation is running at 3.4%, with energy up 16% on the year, so the Fed has a reason to keep going, and swaps price roughly three more quarter-point hikes over the next twelve months.
Second, the record ETF holdings cut both ways. In 2013 gold fell about 28% in a year, and most of the damage came when ETF investors who had bought for crisis protection gave up once the Fed signalled tighter policy. There are more tonnes in ETFs now than at any time in history, bought by people who expected a rescue that hasn’t come.
Third, the buyers who respond to price are leaving. Jewellery demand fell 17% in the second quarter to one of its weakest second quarters on record, and bar and coin demand dipped. Official buying, as above, has slowed. That leaves the price more dependent on investment flows, which are the fastest to reverse.
Forecasters have been retreating too. Goldman has cut its year-end target twice since June, Bank of America cut its 2026 average to $4,360, Citi put its near-term target at $4,000, and the more bearish independent forecasters talk about $3,500 as a floor.
The one thing that argues against a collapse is positioning. Speculators in gold futures hold about 127,000 contracts net long, the middle of their range over the past year and well below the 200,000-plus that has marked crowded tops. There is no fast money forced to sell, which makes a 2013-style crash less likely than a slow grind.
Iran cuts both ways
Most people assume a peace deal would be bad for gold because it removes a geopolitical premium. I think the opposite is more likely. The war is feeding gold’s biggest problem, which is inflation that keeps the Fed hiking. If the Strait reopens and oil falls back below $90, inflation expectations drop, the hikes get priced out, and real yields fall. At the weekend Trump rejected Iran’s offer to reopen the Strait, and on Monday oil and yields rose together while gold fell. A deal would reverse all three.
Kevin makes a related point from the equity side: a durable deal lets the bond market calm down and postpones the end of the AI bubble. I agree, and I think the same deal is the quickest route back to $5,000 for gold, quicker than a crash.
What history says
| Episode | What gold did | What drove it |
|---|---|---|
| 1980–82 | −65%, $850 to $297 | Volcker took real rates from deeply negative to strongly positive. Gold took 28 years to regain its high. |
| 2008 | −30%, Mar to Nov | Forced selling in the crash. Gold bottomed weeks before QE1 and zero rates, then rose about 166% by 2011. |
| 2013 | −28% in the year | The taper tantrum and heavy ETF selling. |
| 2020 | −12%, then +42% | Bottomed four days after the Fed cut to zero and four days before unlimited QE. |
| 2022 | −20%, finished the year flat | Record rise in real yields offset by record central-bank buying. |
Three lessons come out of that table. The first is that crashes hurt gold before they help it. In 2008 and 2020 gold was sold with everything else to raise cash, so the “pain first” part of the bullish crash thesis is right, and anyone buying gold as crash insurance should expect it to fall in the first leg.
The second is that gold turned at the pivot. In both crises it bottomed around the moment the Fed committed to zero rates, before the bond buying had done anything. That is why I think Warsh cutting to zero would be enough on its own.
The third is about timing within hiking cycles. The World Gold Council’s work shows gold rising after the final hike of the 2006, 2018 and 2023 cycles. The point to buy was when the Fed stopped, and we are one hike into this one.
For scale, gold has had eight declines of more than 20% since 1971, with a median of about 29% and an average of about 36%. The summer low near $3,975 was almost exactly the median. The average would put gold near $3,580.
Where I think it goes
| Scenario | Odds | 6–12 month range | What has to happen |
|---|---|---|---|
| Grind, then base | 40% | $3,600–4,200 | The Fed hikes in October and December, real yields stay near 3% and the dollar holds. Gold retests the summer low, probably breaks it, and bottoms around the last hike. |
| Iran deal, yields ease | 25% | $4,600–5,000 | The Strait reopens, oil drops below $90 and hikes are priced out. Real yields fall half a point. |
| Something breaks | 20% | $3,500, then $5,000+ | The bond sell-off hits stocks and credit. Gold falls with everything first, then turns when the Fed cuts. New highs follow within 12–24 months, and $10,000 only if printing follows the cuts. |
| 1980 repeat | 15% | $3,000–3,400 | Warsh keeps hiking into a slowdown, real yields go above 3.5%, ETF holders give up and central banks stay light. |
Put together, I am bearish on gold over the next few months and bullish over the next few years, and the thing that connects the two views is the Fed. Nothing that pushed gold to $5,590 has gone away. The debt is bigger, the deficits are wider, the bond market is already showing the strain, and at some point the rate this government pays on its debt becomes a political problem the Fed is asked to solve. But gold is priced off the path of real yields, and while that path points up I see no reason to be early.
So I’m not interested in chasing bounces while the Fed is still hiking. The level I care about is the summer low near $4,000: a weekly close below it probably means the grind scenario is under way and the average correction near $3,600 comes into view. The setup I’m waiting for is either gold reaching that zone with real yields rolling over, or the Fed signalling that it has finished, whichever comes first. On $10,000, I agree with Kevin: it needs a chair who will print, and this one will cut first and make you wait for anything more.
How I’m wrong
Central banks come back in size. China’s August purchase was its largest in almost three years. If official buying returns to 1,000 tonnes a year, it can overwhelm the real-yield effect as it did in 2022, and the bottom is already in.
The Fed stops sooner. Much of this inflation is energy: petrol alone was more than a third of August’s rise. If oil eases, the case for more hikes weakens quickly, and Warsh believes AI will pull prices down over time. One hike and done would make the summer low the bottom.
The dollar breaks. A lot of the bullish institutional case rests on a weaker dollar. If foreign buyers step back from Treasuries while the Fed holds rates, the dollar could fall even with high yields, and that combination is very good for gold.
What I’m watching
- The ten-year real yield. It is at 2.9%. A turn back below 2.5% would be the clearest sign the pressure is coming off.
- The Fed on 28 October, and any language suggesting the end of the cycle. The last hike has been a better entry than the first.
- ETF holdings. They are at a record. Sustained outflows would be the 2013 warning.
- China’s reserve data, 7 October. Another large month would support the floor.
- The Strait of Hormuz and Brent. Oil below $90 is the fastest way to lower real yields.
- $4,000 on a weekly close. That is the line between a correction and a deeper reset.
Not investment advice. Analysis of publicly reported figures and my own interpretation of them. Gold levels are approximate spot prices and vary slightly between feeds; the record high is given as about $5,590 because published intraday prints range from $5,589 to $5,608. Scenario odds and ranges are my judgement, not a forecast model. Yields, dollar index and market pricing are as of 28–29 September 2026.
Sources
- Meet Kevin (Kevin Paffrath) — YouTube channel
- ZeroHedge / Fringe Finance — Are bonds about to crash the stock market? (24 Sep 2026)
- Vontobel — Monthly CIO update, September 2026
- Federal Reserve — FOMC statement, 16 September 2026
- Federal Reserve — Summary of Economic Projections, September 2026
- Axios — Warsh on the Fed’s balance sheet
- Wolf Street — Warsh’s first moves
- NPR — Senate confirms Warsh as Fed chair
- World Gold Council — Gold Demand Trends Q2 2026
- World Gold Council — Gold ETF flows, August 2026
- World Gold Council — China update, August 2026
- World Gold Council — The impact of monetary policy on gold
- CBS News — Gold down over 21% from its record
- USAGOLD — Daily market report, 29 September 2026
- Kitco — Metals sell as Hormuz stalemate drives yields and dollar higher
- TIPSwatch — 10-year TIPS reopening, 17 September 2026
- Trading Economics — US 10-year TIPS yield
- Treasury yields, 28 September 2026
- Treasury auction results, September 2026
- CBS News — National debt tops $40 trillion
- CBO — Budget and Economic Outlook 2026, summary
- Fox Business — August 2026 CPI
- Advisor Perspectives — FINRA margin debt, August 2026
- Axios — Data-centre debt and Oracle credit default swaps
- Al Jazeera — Oil rises after Trump rejects Iran’s Hormuz plan
- Goldman trims its end-2026 gold forecast, holds $5,400 for 2027
- BNN Bloomberg — BofA cuts its 2026 gold forecast
- Kitco — Citi cuts its near-term gold target to $4,000
- CFTC Commitments of Traders, gold, 22 September 2026
- Gold price correction history since 1971
- World Gold Council — Gold market commentary, December 2022