
Housing Cracks First
Everyone remembers 2008 as a banking crisis. It started as a housing crisis, and housing is wired into everything. Here’s the one chart I’m watching, and why I’ve been mostly in cash.
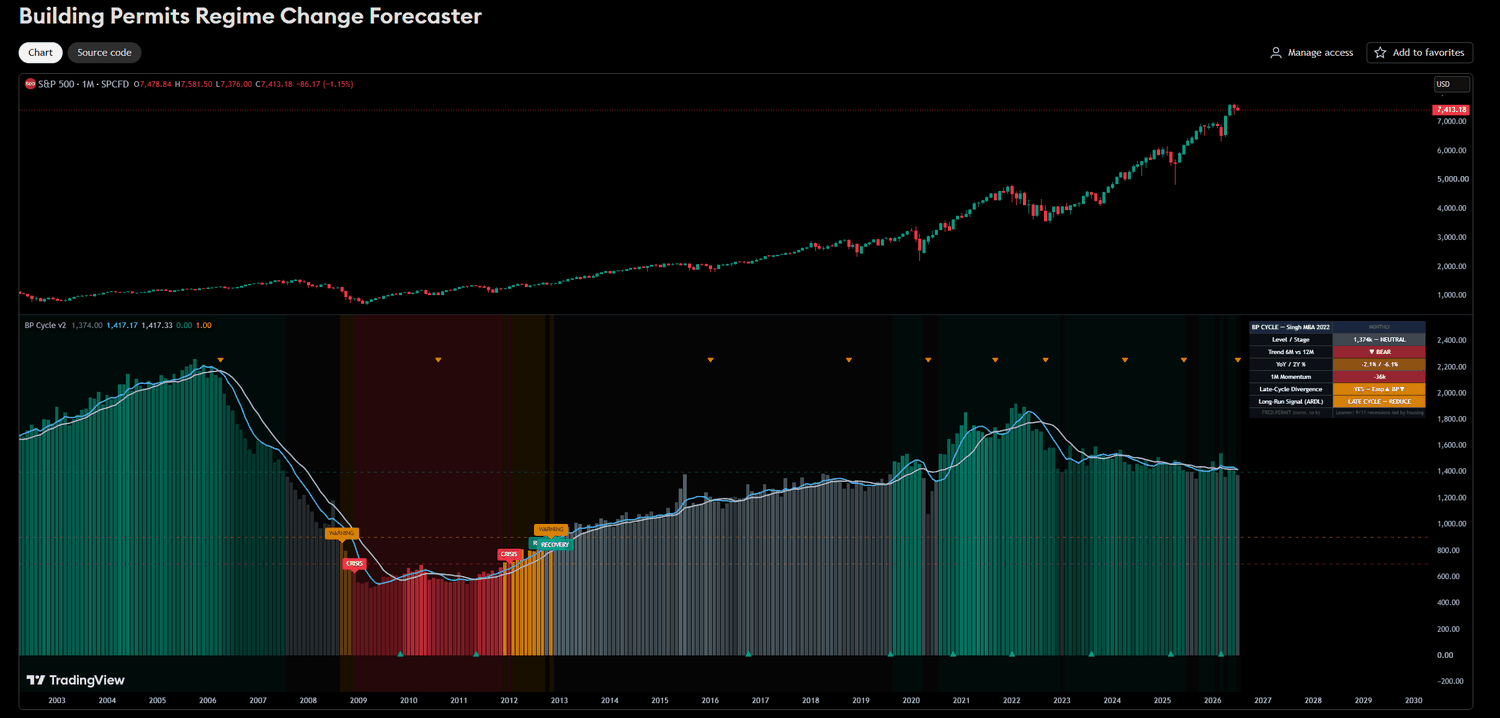
If you traded through 2008, you know the flashing red light wasn’t Lehman. By the time the banks broke, the story was already old. The early tell was the housing market (permits, starts, homebuilder sentiment) rolling over long before the headlines caught up. Permits peaked around September 2005 and the S&P 500 did not peak until October 2007, about two years later.
Real estate is not just another sector. It sits upstream of dozens of others: lumber, building materials, appliances, furniture, banking, insurance, and a big slice of household net worth. When it contracts, the contraction propagates.
What the data says right now
In the May 2026 ISM reports, Wood Products and Real Estate were the only industries contracting in their respective reports: Wood Products in the Manufacturing report and Real Estate in the Services report. Most other industries were expanding, and Construction itself reported growth in the May Services report, which tempers the signal. One month is noise. But it’s the right two industries to be weak if you’re looking for an early housing signal, and it lines up with the mechanism that led 2008.
The signal to watch is building permits. They crack first: before starts, before prices, before the sentiment surveys admit it.
Permits are a leading indicator because they sit at the very front of the construction pipeline: a decision to build, made before a single dollar of activity shows up in the hard data. If permits roll over while the rest of the cycle still looks fine, that’s the divergence that mattered last time.
Where I sit
I’ve been roughly 95% cash since November, trading only. Not because I’m certain something breaks (I’m not), but because the risk/reward of being heavily invested here doesn’t compensate me for the tail I can see forming. Cash is a position. It keeps me patient enough to act when the permits chart actually turns, in either direction. The two-year gap between the 2005 permit peak and the 2007 market peak shows the cost: an investor who acted on the permit signal alone would have sat out a lot of gains, and a mostly-cash stance carries that same opportunity cost.
A note on what I’m watching and why, not investment advice or a market prediction. Cross-check the ISM Report On Business and Census building-permits data before drawing your own conclusions.