
The Monthly Regime Report — October 2026
The S&P 500 finished September roughly where it started, but under the surface most of the market fell. Fewer than half its stocks are above their 200-day average, input prices jumped and the 10-year added 54 basis points. The score slips from −2 to −3, the edge of the bear zone.
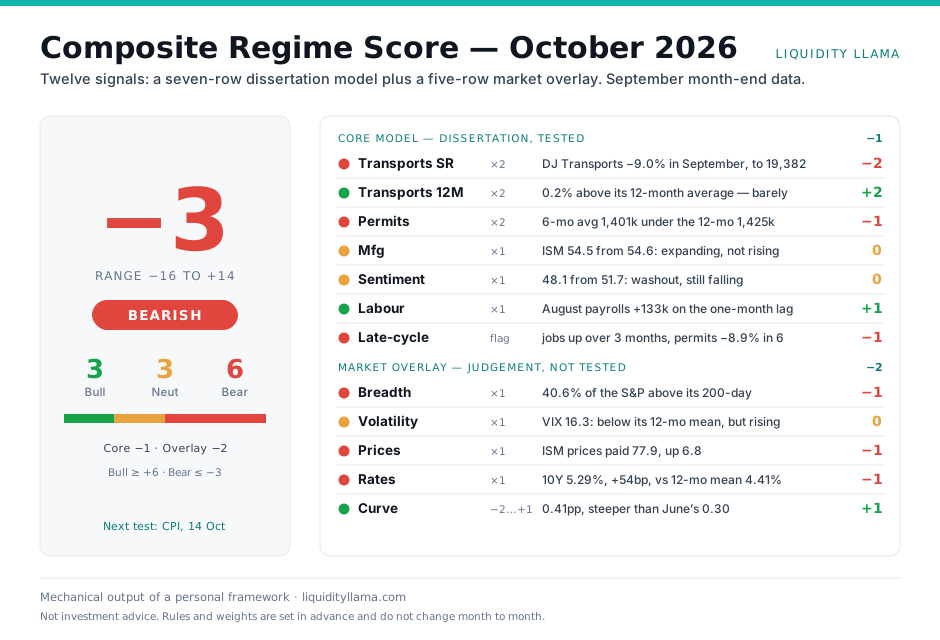
The score moved from −2 to −3. The core model is unchanged at −1. All of the move came from the market overlay, where four of the five rows changed: breadth fell from neutral to bearish (−1), volatility from bullish to neutral (−1), prices from neutral to bearish (−1), and the curve went from bearish to bullish (+2). A score of −3 is exactly the bear threshold. The model doesn’t say a bear market has started. It says the conditions behind a rising market are now weaker than the conditions working against it.
How last month’s call aged
September’s score was −2, neutral, with the instruction to keep tilts small while the regime was neutral. The S&P 500 (SPY) went from 767.05 at the end of August to 762.63 at the end of September, and 774.83 on 5 October. On the index, the neutral call looks correct, if anything too cautious.
The index hides what happened underneath. On 4 September, 64% of S&P 500 stocks were above their 200-day average. By 30 September it was 40.6%. The average stock had a bad month, and the index was held up by semiconductors and a few large technology names. Industrials fell 2.9%, financials 6.6%, materials 6.1%, homebuilders 6.3% and utilities 5.4%, while semiconductors (SMH) rose 13.9%.
| Instrument | 31 Aug | 30 Sep | 5 Oct | Change |
|---|---|---|---|---|
| S&P 500 (SPY) | 767.05 | 762.63 | 774.83 | +1.0% |
| Nasdaq 100 (QQQ) | 716.76 | 739.77 | 756.20 | +5.5% |
| Semiconductors (SMH) | 556.63 | 609.00 | 633.90 | +13.9% |
| Nvidia | 220.78 | 228.38 | 238.90 | +8.2% |
| Industrials (XLI) | 175.13 | 166.98 | 170.10 | −2.9% |
| Financials (XLF) | 57.71 | 53.40 | 53.88 | −6.6% |
| Materials (XLB) | 52.69 | 48.70 | 49.50 | −6.1% |
| Energy (XLE) | 63.96 | 61.50 | 63.45 | −0.8% |
| Homebuilders (XHB) | 102.81 | 96.03 | 96.30 | −6.3% |
| Utilities (XLU) | 42.23 | 39.44 | 39.97 | −5.4% |
| Staples (XLP) | 84.98 | 80.60 | 81.04 | −4.6% |
| Long bonds (TLT) | 82.52 | 77.78 | 77.11 | −6.6% |
| 7–10yr bonds (IEF) | 92.74 | 89.31 | 88.92 | −4.1% |
| Gold (GLD) | 408.42 | 380.84 | 379.55 | −7.1% |
| Silver (front month) | 66.22 | 60.10 | 61.40 | −7.3% |
| Bitcoin | 78,549 | 83,554 | 85,737 | +9.2% |
| Ether | 2,467 | 2,684 | 2,711 | +9.9% |
| VIX | 14.92 | 16.34 | 15.52 | +4.0% |
Last month’s levels against this month’s
Last month’s figures are the ones published on the homepage panel, with the date of each reading. This month’s scoring column is the September month-end figure the score uses.
| Signal input | Last month | Scored now | Latest |
|---|---|---|---|
| DJ Transports | 20,628 (11 Sep) | 19,382 | 19,792 (5 Oct) |
| S&P 500 stocks above 200-day | 56.5% (14 Sep) | 40.6% | 42.5% (2 Oct) |
| VIX | 15.85 (14 Sep) | 16.34 | 15.52 (5 Oct) |
| 10-year Treasury | 5.17% (25 Sep) | 5.29% | 5.31% (5 Oct) |
| 10Y−2Y spread | 0.36pp (25 Sep) | 0.41pp | 0.47pp (5 Oct) |
| ISM manufacturing | 54.6 (Aug) | 54.5 (Sep) | — |
| ISM prices paid | 71.1 (Aug) | 77.9 (Sep) | — |
| Building permits | 1,433k (Jul) | 1,403k (Aug) | — |
| Consumer sentiment | 51.7 (Aug) | 48.1 (Sep) | — |
| Payrolls, first print | +162k (Aug) | +29k (Sep) | Aug revised to +133k |
What changed in the data, and why it matters
1. The rally narrowed to one theme
Breadth is the clearest change. When the index holds up while fewer than half its members sit above their 200-day average, the gains are coming from a small group of large companies. That can go on for a long time, but it means the index is more exposed to a single theme than it looks. Here, that theme is AI spending: semiconductors, grid equipment and power. The ISM shows the same thing from the factory side — Electrical Equipment, Computer & Electronic Products and Primary Metals lead the rankings while Machinery and Transportation Equipment slip down them.
2. Inflation pressure re-accelerated
ISM prices paid jumped 6.8 points to 77.9, services prices rose to 74.0, and the University of Michigan’s one-year inflation expectation rose to 4.6%. TD Economics pointed to steel and aluminium tariffs and petroleum costs. Purchasing managers named tariffs in 34% of negative comments and the Iran war in 30%. The Fed raised rates to 3.75–4.00% on 16 September. Growth holding up while input prices rise faster is the combination that makes another hike more likely, and the long end of the bond market has already moved to price that in.
3. The labour data split from the surveys
ISM factory employment rose to 52.7 and services employment came back to 50.1. Payrolls said something different: +29k in September, with 60k of downward revisions that left July negative, and unemployment up to 4.2%. The Labour row still scores +1, because the model uses a one-month lag and August was positive. If October’s payrolls are weak too, that row turns bearish in December. When survey data and hard data disagree like this, the hard data has usually been right.
4. Transports broke, then bounced
DJ Transports fell 9.0% in September, the largest monthly fall in the series this year, and finished just 0.2% above its 12-month average. The two transport rows are worth four points each way between them, and both are now close to their trigger levels. This is the most important number to watch in October.
The verdict
- ISM new orders 55.3 (+1.6), backlogs 56.4 (+4.6). The factory order book refilled after August’s fall, which supports output into year-end.
- Factory employment 52.7, a third month above 50. Manufacturing payrolls +9k agree with it.
- DJ Transports still above its 12-month average (19,382 against 19,342), and up 2.1% so far in October. The long-run trend has not broken.
- VIX 16.34, below its 12-month mean of 17.3. The breadth damage happened without a volatility spike, which is not what a panic looks like.
- Breadth 40.6%, from 64% in early September. Most of the market fell while the index held up.
- ISM prices 77.9 (+6.8) in a hiking cycle, with services prices at 74.0 and consumer inflation expectations at 4.6%.
- 10-year 5.29%, up 54bp in a month and 88bp above its 12-month mean. Long bonds fell 6.6%.
- Payrolls +29k and −60k of revisions. July is now negative and unemployment is 4.2%.
- Consumer sentiment 48.1, falling deeper into washout rather than turning up.
- September CPI, 14 October. The first hard check on the ISM prices jump.
- FOMC, 27–28 October. A second hike would hit everything rate-sensitive again.
- DJ Transports’ October close against 19,382. Above it, the Transports SR row flips +4 and the score likely leaves the bear zone.
- Breadth back above 50%. That would take the Breadth row from −1 to 0 or +1.
- October payrolls, 6 November. A second weak print turns the Labour row bearish.
Names the framework points at
The same list as this month’s PMI Playbook, where each idea is explained in full and last month’s names are marked to market. These are screens to research, not positions. No entry prices, targets, stops or position sizes.
| Idea | Which number drives it | What kills the thesis |
|---|---|---|
| Grid & electrical equipment ETN · PWR · HUBB · GRID | Electrical Equipment #1 of 12 on growth, #2 on new orders, #1 on employment. | Dropping out of the top five on new orders on 2 November, or a hyperscaler capex cut. |
| Semiconductors & equipment SMH · NVDA · AMAT | Computer & Electronic #3 on new orders, #5 on growth: orders leading. | Falling off the new-orders growth list. SMH is already +13.9% since August. |
| Aggregates & building materials VMC · MLM | Nonmetallic Minerals #1 on new orders, #2 on growth. | Leaving the top five on new orders, or non-residential construction contracting. |
| Steel with pricing power NUE · STLD | Primary Metals #3 on growth, #2 on employment; prices paid 77.9. | Prices paid back below 71, or Primary Metals sliding below #6 on new orders. |
| Industrial distributors FAST · GWW | Customer inventories 41.6, a 24th month too low. | Customer inventories back above 48. |
| Long-duration Treasuries TLT · ZROZ | Prices 77.9; 10-year 5.29% above its 12-month mean of 4.41%. | A soft CPI on 14 October and a Fed hold on 28 October. |
| Homebuilders & housing XHB · DHI · LEN | Permits 6-month average 1,401k under the 12-month 1,425k; Wood Products orders falling. | The 6-month permits average back above the 12-month. |
| Transports IYT · ODFL · JBHT | DJ Transports −9.0% in September; Transportation Equipment #9 of 12. | DJ Transports closing October above 19,382. |
| Cost-squeezed processors DOW · LYB · XLP | Chemicals #12 of 12; Chemicals and Food both shedding jobs while prices hit 77.9. | Prices paid back toward 71, or Chemicals rising up the growth list again. |
The next tests
September CPI on 14 October is the first. A hot print confirms the ISM prices jump and makes a second hike at the 27–28 October FOMC likely; a soft one would hurt every short on the list at once. Then the October ISM on 2 November and October payrolls on 6 November. The single number that can move this score most, though, is the DJ Transports close on 30 October: above 19,382 and the score probably goes back to neutral; another fall and it moves deeper into the bear zone.
For educational purposes only. Mechanical output of a personal framework, shared to show process. Rows scored on September 2026 month-end data; market levels as at the 5 October 2026 close. Not investment advice.
Sources
- ISM — Manufacturing PMI at 54.5%, September 2026 Report On Business
- ISM — Services PMI at 54.9%, September 2026
- TD Economics — U.S. ISM Manufacturing Index
- BLS — Employment Situation, September 2026
- ABA Banking Journal — Final consumer sentiment, September 2026
- FRED — Building permits (Census)
- FRED — 10-year minus 2-year Treasury spread
- Investing.com — S&P 500 stocks above 200-day average