
The Yen Carry Trade: Ticking Time Bomb
Japan and the United States just ran their first joint yen intervention since 2011. The trade underneath it is real, it is leveraged, and it has broken markets before. It is also paying half what it paid in 2024 — and almost nobody explaining it has mentioned that.
The argument in four lines
- The carry trade is a leveraged loan in a currency you don’t control. Borrow cheap yen, buy dollar assets, keep the difference — until the yen moves against you.
- When it unwinds, traders sell whatever is easiest to sell. That is US large-cap equities, which is why a Japanese currency headline hits your portfolio.
- But the carry is now ~2.6 points, not ~5.3. Positions are smaller and the cushion is thinner. It is a different, smaller bomb than 2024’s.
- It needs a surprise to detonate. Both central banks meet in September and both have already signalled. Signalled moves are the fuse being cut, not lit.
What actually happened
On Friday 31 July, Japan’s Ministry of Finance intervened in the currency market to buy yen. The United States Treasury joined in. Both governments confirmed it on Monday 3 August.
That is genuinely unusual. The last coordinated US–Japan action was 2011, after the Tōhoku earthquake — and that one was to push the yen down, not up. Washington intervening to support another country’s currency is rare enough to be a signal in itself.
Three details are worth having straight, because most retellings garble them.
- The size. Bank of Japan account data suggests Japan spent up to $36.58bn in the single Friday operation. Some desk estimates put the full episode at $60–80bn. It was large. It was not the $87bn-in-two-days figure circulating online, and the “biggest in history” claim depends entirely on which window you measure.
- The American side. The US Treasury did not sell dollars — it sold euros to buy yen, keeping the dollar out of it. Treasury Secretary Scott Bessent’s notepad, photographed at a Camp David cabinet meeting, read “Buy Japanese Yen (JPY) $5–10 bil.” The photograph is real and Reuters published it. Whether leaving it face-up was an accident is a separate question.
- The $60bn “facility”. This is the part most commonly misdescribed. The Fed’s FIMA repo facility was created in 2020 and made permanent in 2021. Any approved foreign central bank can already pledge Treasuries for up to $60bn of dollars per day. Nothing new was “set up” for Japan. What is new is that Bessent is publicly pressing the Fed to expand the cap — which is why the story has an awkward central-bank-independence sub-plot attached to it.
The trade, explained simply
Strip away the jargon and the carry trade is a mortgage taken out in a foreign currency.
You borrow yen, because Japanese interest rates are the lowest in the developed world. You immediately sell those yen and buy dollars. You use the dollars to buy something that pays more — US Treasuries, US equities, credit. You pocket the difference between what you pay in Tokyo and what you earn in New York.
Do it once with your own money and you earn a couple of percent. Do it with leverage, which is what institutions do, and a couple of percent becomes a respectable return. This is not obscure or improper. It is one of the oldest trades in global macro, and the participants are largely not Japanese — they are international hedge funds and asset managers.
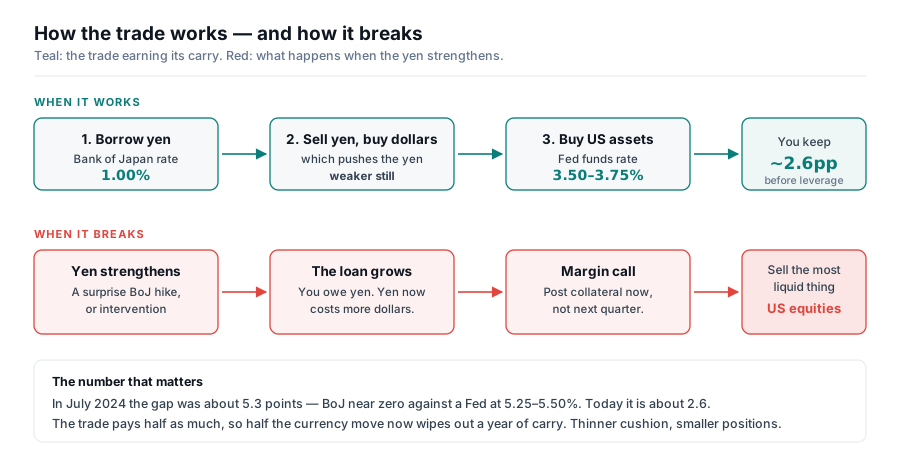
There is one condition the whole thing rests on: you have to repay in yen. As long as the yen keeps weakening, the loan shrinks in dollar terms and you earn the carry and a currency gain. That has been the trade for years, which is why the yen has been drifting toward multi-decade lows.
Why it’s dangerous
The danger is not that the trade loses money. Trades lose money constantly. The danger is how it loses money.
A stronger yen doesn’t reduce your profit. It increases your debt.
When the yen appreciates, the loan you took out grows in dollar terms while you sleep. Leverage means you do not get to wait it out: the broker asks for collateral now. And to raise cash quickly you sell not what you want to sell, but what you can sell — the most liquid, most easily-priced thing on the book. In practice that means large-cap US equities and index futures.
That is the whole transmission mechanism, and it explains the thing that looks inexplicable: why a currency headline about Japan can knock a percent off American stocks in under an hour, with no news whatsoever about American companies. It is not a judgement about earnings. It is a margin clerk.
Three properties make it genuinely hazardous rather than merely annoying:
- It is crowded. Everyone runs a version of the same position, so everyone receives the same margin call on the same morning.
- It is reflexive. Unwinding the trade means buying yen, which strengthens the yen, which forces more unwinding. Selling begets selling.
- It is invisible until it isn’t. There is no exchange, no published open interest, and no reliable total. Estimates of the outstanding position range from about $261bn to $500bn, which is a polite way of saying nobody actually knows.
The number nobody mentions
Here is where I part company with the popular explanations, and it is the single most useful thing in this piece.
The trade is routinely described as “borrowing at zero in Japan.” That stopped being true. The Bank of Japan raised its policy rate to 1.00% in June 2026 and held it there on 31 July by an 8–1 vote. Ten-year JGB yields have reached a 29-year high near 2.8%. Japan is not a zero-rate country any more.
| July 2024 | Now | |
|---|---|---|
| Bank of Japan policy rate | ~0–0.10% | 1.00% |
| Fed funds target | 5.25–5.50% | 3.50–3.75% |
| Gross carry | ~5.3 points | ~2.6 points |
| Estimated position | Peak, $300–500bn | Contracted, ~$261bn+ |
Read that table in both directions, because it cuts both ways and the honest answer is that it is genuinely two-sided.
The reassuring reading: there is simply less of this trade than there was. It has been unwinding, in stages, since August 2024. A smaller position produces a smaller forced sale.
The uncomfortable reading: carry is the cushion. It is what absorbs currency moves before you start losing money. At 5.3 points you could tolerate a 5% yen rally over a year and break even. At 2.6 points, half that move puts you underwater. Each surviving position is more fragile per dollar than it was two years ago.
Smaller bomb, shorter fuse. That is the accurate summary, and it is more useful than either “this is fine” or “this is 2008.”
What the popular version gets wrong
This report was prompted by two widely-circulated explanations of the episode. Both are directionally right about the mechanism and wrong on several specifics. The specifics matter, because they are what people repeat.
| The claim | What the record shows |
|---|---|
| “Japan keeps rates at basically zero” | The BoJ policy rate is 1.00%, raised in June 2026. Ten-year JGBs sit near a 29-year high. The premise of the trade has already halved. |
| “$53bn in one day” / “$87bn in two days” — biggest ever | BoJ account data implies about $36.6bn on the day, with desk estimates of $60–80bn for the episode. Large, but the superlative is doing heavy lifting. |
| “The US set up a $60bn-a-day facility for Japan” | The FIMA repo facility has existed since 2020 and is open to all approved central banks. Bessent is lobbying to expand it. Historic peak usage was around $1.4bn. |
| “Hedge funds hold about $10bn of bets against the yen” | Off by more than an order of magnitude. Credible estimates run $261bn to $500bn. |
| “Korea crashed because the carry trade unwound” | The KOSPI’s record month was driven by a repricing of AI memory demand — Samsung and SK Hynix are the index. Leverage amplified it. The carry trade was not the trigger. Sources also disagree on the size, quoting between −23% and −33%; I would not repeat any single figure with confidence. |
| “Worst case: the Fed pauses while the BoJ hikes” | This was the 2024 shape. It is not the current setup — the Fed hinted at a hike in September, with nine of nineteen participants projecting higher rates this year. See below. |
The 2024 precedent, and why it was worse
On 31 July 2024 the Bank of Japan raised rates 25bp when the market did not expect it. What followed on 5 August was the largest single-day cross-asset shock since March 2020: the Nikkei fell 12%, its worst day since 1987, the VIX spiked to 65, and the S&P 500 dropped about 3%.
Two features of that episode are worth carrying forward. First, the trigger was not the size of the hike — 25 basis points is nothing — it was that nobody was told. Second, the damage was concentrated and fast, and the recovery was also fast: US equities repaired most of the drawdown within weeks. An unwind is a liquidity event, not a solvency event. It hurts leveraged holders far more than it hurts patient ones.
Three scenarios
The scenario framework here is adapted from one of the explanations circulating online, with the probabilities and the middle case revised for what the Fed has actually signalled since.
| Scenario | What it looks like | Market effect |
|---|---|---|
| Contained most likely | USD/JPY holds roughly 155–160. Both banks move in September, both flagged in advance. The differential barely changes. | Noise. Intraday dips that fill. The topic disappears from the news within a fortnight. |
| Squeeze plausible | One side surprises by a single step — a BoJ hike the market half-expected, or a Fed hold when a hike was priced. Yen rallies toward 150. | A sharp, days-long risk-off in the most crowded momentum names. Uncomfortable, not structural. |
| Disorderly unwind low probability, high impact | The yen strengthens fast and far — through 150 toward 140 — while the BoJ signals multiple further hikes unprompted. Japanese inflation surprises high; US inflation surprises low. | August 2024 again: volatility spike, forced liquidation of leveraged positions, US yields whipsawing, Japanese equities worst hit. |
How it gets defused
You asked how this is avoided. There are two answers, because there are two people who can act: the authorities, and you.
What the authorities can do
- Signal everything, surprise nobody. This is the whole lesson of 2024. Markets absorb bad news that arrives on schedule and choke on good news that arrives unannounced. The BoJ pre-committing to a hike path costs it flexibility and buys enormous stability.
- Close the gap from the correct end. A slow BoJ tightening cycle shrinks the carry gradually, which lets positions be reduced in an orderly way. The differential closing over eighteen months is a defusal. The same move compressed into one meeting is a detonation.
- Fix Japan’s dollar plumbing. Expanding FIMA lets Japan raise dollars against its Treasuries rather than dumping them. It treats the symptom — but the symptom is a US yield spike, so it is worth treating.
- Accept that intervention buys time, not outcomes. The 2022 and 2024 interventions faded within weeks. This one moved the yen from roughly 164 to 157 and largely gave it back. Intervention against a real rate differential is a speed bump.
What an ordinary investor can actually control
Nothing here is advice about what to buy, and none of it involves predicting Tokyo. It is about not being the marginal seller.
- Know your own leverage. The carry trade only destroyed people who were levered. If you hold nothing on margin, a carry unwind is a price move you sit through, not a phone call you have to answer. This is the single largest determinant of whether the event hurts you.
- Know your crowding. In August 2024 the damage was wildly uneven: the most owned, most momentum-driven names fell furthest, because those are what leveraged books hold and what gets sold first. A portfolio that is the crowd behaves like the crowd.
- Decide in advance, not at 3am. These events resolve in days. There is no time to form a view once it starts. Whether you would buy that drawdown or ignore it is a decision worth making now, while nothing is happening.
- Distrust the “this is 2008” framing. A carry unwind is a funding event, not a credit event. In 2024, US equities recovered most of the fall within weeks. The people who lost permanently were the ones who were forced out, and the ones who sold because they were frightened.
- Notice who is selling you the panic. Both of the explanations that prompted this report ended in a paid seminar or an app subscription. That does not make them wrong. It does mean the incentive runs toward “time bomb” and away from “probably contained.”
What to watch, with dates
| Watch for | When | What it would tell you |
|---|---|---|
| USD/JPY through 160 | Any time | The level that has repeatedly drawn intervention. Sustained trade above it raises the odds Tokyo is forced into an unsignalled move. |
| Bank of Japan, September meeting | September | A hike is half-expected. The size is not the signal — the guidance is. Language pointing to multiple further hikes is the genuine risk event. |
| FOMC decision | 16 September | A hike keeps the differential roughly intact. An unexpected hold is the shape that squeezed the trade in 2024. |
| Japanese CPI prints | Monthly | Inflation above target is what removes the BoJ’s discretion. A central bank that has run out of choices is the one that surprises you. |
| Japan’s Treasury holdings | TIC data, monthly | Japan sold roughly $30bn of Treasuries in Q1 2026, the fastest in four years. Continued selling means the FIMA route isn’t working. |
| A second joint intervention | Any time | Escalation. It would say the first one failed, and that the authorities are now the ones who are worried. |
Where I land
The bomb is real. The carry trade is a large, leveraged, crowded position that has already demonstrated once that it can take 12% out of the Nikkei in a session, and there is no central registry telling anyone how big it is today.
But the honest reading of the current numbers is that this is a smaller charge on a shorter fuse than 2024. The differential that funds the trade has roughly halved, the position has contracted, and — most importantly — both central banks have now told the market what they are likely to do in September. The 2024 crash required a surprise. Nothing surprising has happened yet.
What would change my view is not a bigger intervention. It is silence: a Bank of Japan that stops guiding, or moves between scheduled meetings. That is the tell. Until then, the correct posture is to know your leverage, know your crowding, and treat “ticking time bomb” as a description of the structure rather than a forecast of the week.
Not investment advice. Analysis of publicly reported figures and my own interpretation of them. Figures were checked against contemporaneous reporting in August 2026; the intervention size is an estimate derived from Bank of Japan account data, not an official disclosure, and estimates of the outstanding carry position vary widely by source. Where sources conflict — notably on the KOSPI’s July decline — that is stated rather than resolved. This report was prompted by explanations circulating online; the scenario framework is adapted from one of them with revisions noted in the text, the figures were independently verified against primary reporting, and the conclusions are my own. Verify everything against primary sources before acting on it.
Sources
- CNBC — US and Japan confirm coordinated yen intervention
- The Japan Times — Japan and US confirm joint yen intervention
- The Japan Times — Bessent’s ‘to do’ list, photographed
- CNBC — How Bessent is pushing the Fed to expand the FIMA facility
- Bloomberg — BoJ holds at 1.00%, upgrades economic outlook
- CNBC — Fed holds at 3.50–3.75%, hints at a September hike
- Investing.com — UBS on the size and progress of the carry-trade unwind
- Fortune — the KOSPI rout and its AI-memory trigger