
PMI Playbook — Buys & Sells · August 2026
The ISM Report On Business is one of the highest-signal macro releases most people never read. What this month’s numbers say, which sectors that favours, and where to read the full report yourself — free.
The buys and sells
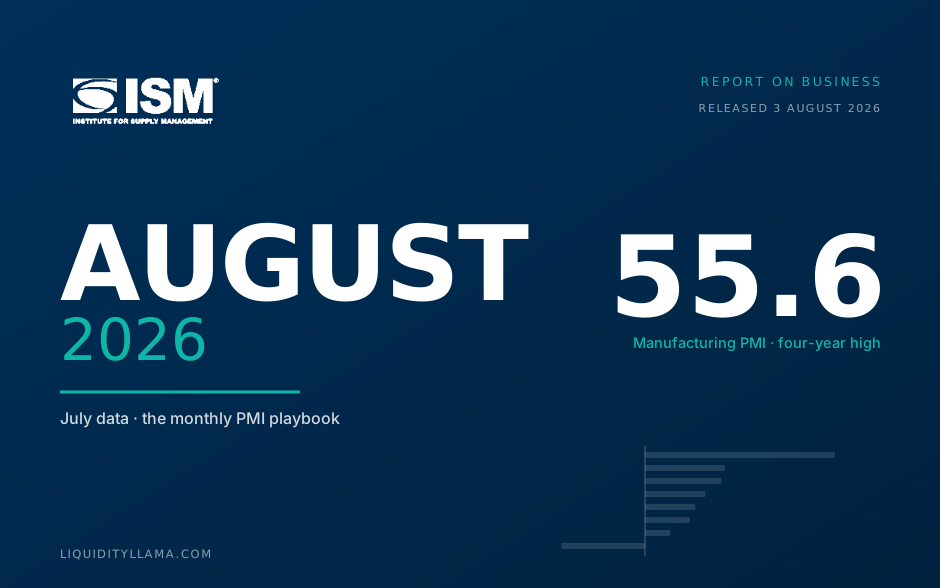
From the July report, released 3 August — manufacturing 55.6, a four-year high, with 15 of 18 industries expanding — the framework’s tilt leans harder into the cycle. Research starters, not advice.
- Industrials 52w high, PMI 55.6
- Semiconductors +14% off the lows
- Financials 52w high, steep curve
- Materials inventories too low
- Data-center / power capex theme
- Long-duration bonds still at 52w lows
- Rate-sensitive housing permits ▾
- Real Estate contracting
- Defensives wrong side of the cycle
What the read means
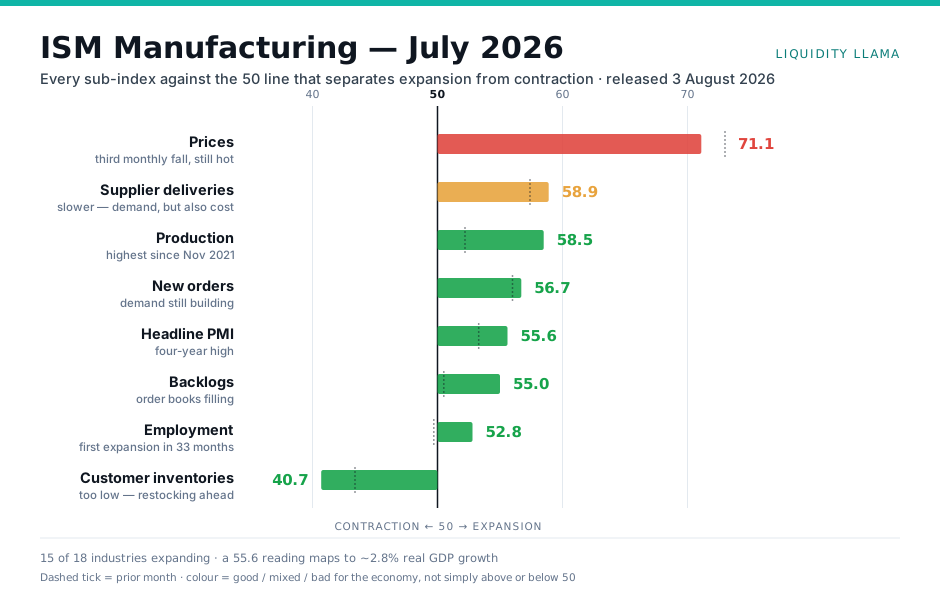
Manufacturing at 55.6 is the strongest print since May 2022 and the seventh straight month of expansion. It beat the 54.0 consensus by a wide margin. ISM’s own translation: a 55.6 reading historically corresponds to real GDP growing at about 2.8% annualised.
Three things in the release matter more than the headline:
- Employment crossed 50 after 33 months below it, at 52.8 from 49.7. Factory payrolls have been contracting since late 2023; this is the first month they haven’t. One month is not a trend, but it’s the single most important line in the report.
- Production did the heavy lifting — up 6.3 points to 58.5, the highest since November 2021. Backlogs jumped to 55.0 from 50.5, so this isn’t firms working through old orders; new work is arriving.
- Customer inventories at 40.7 are far too low. That reads as a restocking cycle waiting to happen, which is a forward demand signal rather than a description of the past month.
The awkward line is supplier deliveries at 58.9, up from 57.4. Slower deliveries are usually a demand signal, but they also mean cost pressure — and combined with hot input prices, that shapes the tilt toward cyclicals that can pass those costs on rather than cyclicals generally.
The verdict
- Employment crossed 50 after 33 months. The longest factory-jobs contraction since the 1980s just ended. Nothing else in the release matters as much.
- Production at a four-year high with backlogs jumping to 55.0. Firms aren’t clearing old orders — new work is arriving faster than they can build it.
- Customer inventories at 40.7. Stock levels this thin force restocking. That’s demand you can see coming rather than demand you have to forecast.
- Breadth, not a spike. 15 of 18 industries expanding means this isn’t one sector flattering the average.
- Long bonds still at 52-week lows. The one signal that hasn’t joined the party. A cyclical upturn financed at rising long rates is a materially worse trade than one financed at falling rates.
- Input prices remain hot and supplier deliveries slowed again to 58.9. Slower deliveries flatter the headline PMI while describing a cost problem.
- Real estate is still contracting, and building permits are trending down. Housing has led every meaningful cycle turn of the last forty years — it is not confirming this one.
- One month is one month. The employment print reverses 33 months of contraction. Base rates say wait for the second one.
- Next payrolls. The single confirmation that matters. Factory employment expanding in the survey but not in the hard data would kill the thesis.
- Whether TLT stops making lows. That would remove the last bearish signal and take the regime score materially higher.
- Services employment at 47.4 — printed 5 Aug, back in contraction after one month above 50. The labour recovery is now a manufacturing-only claim until payrolls says otherwise.
- Prices paid rolling over. Falling input costs turn a demand recovery into a margin recovery, which is a different and better trade.
- Building permits. If they turn up, the one genuine hole in the bull case closes.
Names the framework points at
These follow mechanically from the sub-indexes above — each one is here because a specific number in the report says so, not because it looks good on a chart. They are screens to research, not positions. No entry prices, because the level you pay is your decision and the point of this list is the reasoning.
| Idea | Which number drives it | What kills the thesis |
|---|---|---|
| Machinery & electrical equipment CAT · ETN · PH |
Production 58.5 and backlogs 55.0. These are the businesses that convert a backlog into revenue first. | Backlogs rolling back under 50 — order books emptying faster than they refill. |
| Industrial distributors FAST · GWW |
Customer inventories 40.7. Distributors are the most direct read on restocking — they sell the pick-and-shovel consumables first. | Customer inventories climbing back above 48; restocking already done. |
| Materials into restocking NUE · FCX · XLB |
New orders 56.7 with inventories too low. Volume recovery reaches raw inputs before finished goods. | China demand disappointing, or the dollar strengthening hard. |
| Banks on a steeper curve XLF · JPM |
Long yields at 52-week highs while the front end is anchored. Wider deposit-to-loan spread is mechanical, not narrative. | Credit costs rising faster than the spread benefit — watch provisions, not net interest margin. |
| Data-centre power capex ETN · PWR · VRT |
The one theme where the ISM cycle and the AI capex cycle point the same way. Grid connections are the bottleneck. | A hyperscaler cutting capex guidance. This is the theme’s single point of failure. |
| Long-duration Treasuries TLT · ZROZ |
A 55.6 PMI implying 2.8% real GDP is not a backdrop that rallies 30-year bonds. | Payrolls missing badly — growth scare bids duration hard and fast. |
| Bond-proxy defensives XLU · XLP |
Bought for yield when growth is scarce. Growth is no longer scarce, and the yield is competing with a 52-week-high long bond. | The employment print reversing — defensives are the correct hedge if this is a false dawn. |
| Rate-sensitive housing XHB · DHI · VNQ |
Real Estate contracting in the survey, permits trending down, mortgage rates following the long end higher. | Permits turning up, or a genuine dovish shift at the long end. |
Read it yourself — it’s free
You don’t need a terminal or a subscription for any of this. The ISM Report On Business is published free, in full, and most people never look at it. Two places to find it:
ismworld.org — the month is the last part of the address, so you can jump to any month by changing one word:
ismworld.org/…/ism-pmi-reports/pmi/july/
This is the one to read. It carries all 18 industries ranked in order and the verbatim comments from the purchasing managers themselves — the two things that turn a headline number into an actual view, and the two things every news summary throws away.
PR Newswire — published free the moment it’s released: first business day of the month for manufacturing, third for services.
Identical headline and sub-index figures, plain text, no sign-up. If you only want the numbers, this is quicker.
What to do with it. Read the manager comments first. Sixty seconds of people describing their own order books tells you more than the headline number does — you’ll see tariffs, shortages and hiring freezes in plain language weeks before they show up in official data. Then check whether the sub-indexes agree with each other: production and new orders rising together is a real expansion, production rising while new orders fall is a company working through a backlog it hasn’t replaced.
If you want a second opinion on the interpretation, TD Economics and PNC both publish free same-day notes and will flag anything odd in the seasonal adjustment before you build a view on it.
Not investment advice. The tilts are framework-generated research starters. Sources: July 2026 ISM Manufacturing Report On Business via PR Newswire; TD Economics; PNC Economics Research.